Predictors of Survival among Adrenal Cortical Carcinoma Cases

The following is an overview of an independent research project of mine that I presented at a national conference.
Background
Adrenal cortical carcinoma (ACC) is a rare and aggressive cancer with poor prognosis. It is the second most aggressive endocrine cancer following anaplastic thyroid cancer and has an estimated annual incidence of 0.7–2.0 cases/million. Because of the low incidence of these tumors, data on prognostic factors and survival outcomes are limited. The aim of this analysis was to examine demographic, clinical, and tumor characteristics as potential predictors of overall survival using the 1975-2016 Surveillance, Epidemiology, and End Results (SEER) program data set, which encompasses approximately 34.6% of the US population.
Methods
Reported cases of ACC from 2006 to 2015 were identified, and relevant demographic and clinicopathological data were retrieved, including age at diagnosis, sex, race and ethnicity, tumor laterality, tumor grade, tumor size, clinical summary stage, and surgical treatment. Cases were limited to adults to account for established differences between adult and pediatric ACC patients in incidence, clinical presentation, and biological behaviors. Multivariable Cox proportional hazards regression was utilized to examine the associations between overall survival and demographic and tumor-specific variables. Tree-based survival analysis (TBSA) was used to further elucidate the relationship between potential predictors and mortality risk.
While not as widely used as the Cox Proportional Hazards model for survival data, survival trees are useful nonparametric alternatives. Tree-based methods are simple, easily interpreted, and flexible. Similar to other regression tree analyses, TBSA adaptively partitions the study populations into groups that have different survival distributions, helping to identify hierarchical predictive relationships. The method used in this analysis follows a recursive partitioning algorithm that adopts most aspects of the well-known classification and regression tree algorithm. Using the first step of a full likelihood estimation procedure for the splitting criterion, this method is able to obtain tree-structured relative risk estimates for censored survival data. After growing the initial survival tree, cross-validation and a cost-complexity pruning algorithm were utilized to identify the optimally-pruned tree.
Results
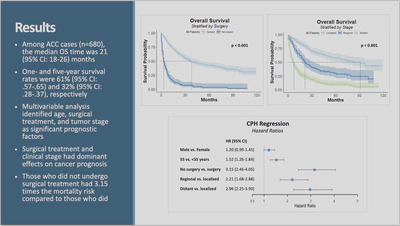
Among ACC cases, the median overall survival time was 21 months, and one- and five-year survival rates were 61% and 32%, respectively. Log-rank tests revealed significant differences in overall survival when stratified by surgery, stage, age, and sex.
Age, surgical treatment, and tumor stage were found to be significant prognostic factors for overall survival, with surgical treatment having a dominant effect. Those who did not undergo surgical treatment had 3.24 times the mortality risk compared to those who did. Clinical stage was also an important predictor. Those with localized cancer had significantly lower mortality risk compared to those with regional and distant cancer. Compared to those with localized cancer, those with regional cancer had 2.23 times the mortality risk, while those with distant cancer had 3.09 times the mortality risk.

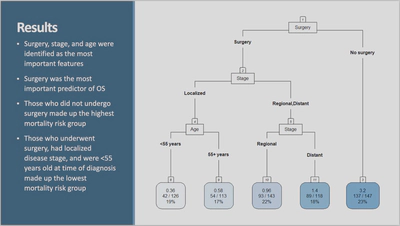
The results of TBSA corroborated these findings. Sex, age, race and ethnicity, surgical treatment, clinical stage, and tumor size were included in the TBSA modeling. Using the optimal complexity parameter (which controls the trade-off between the subtree’s complexity and its fit to the data) and cross validation to identify the optimally pruned tree, we see here the final subtree consisting of 5 terminal nodes. Only surgery, stage, and age were selected as significant predictors in the model. Surgical treatment (seen as the root node) was found to have the greatest importance in the model, followed by clinical stage, then age. Those who did not undergo surgical had the highest relative mortality rate according to the computed relative risk estimates, which can be seen in the top line of each terminal node. Looking at the farthest terminal node to the right, we can see that those who did not undergo surgical treatment had a relative mortality rate of 3.2 times the overall mortality rate. To find the prognostic group with the lowest relative mortality rate, we start at the root node (surgery) and work our way down the left of the tree. Those who underwent surgery, had localized disease stage, and were <55 years old at time of diagnosis had the lowest relative mortality rate at 0.32 times the overall mortality rate.
